Gold
Gold rebounded in the first half of Monday’s session following a sharp decline on Friday. However, this recovery was not driven by any specific factors, especially with the U.S. market closed today and a relatively quiet macroeconomic calendar. With prices now hovering around the key $2900 level, the next moves could set the tone for the coming days. Friday’s bearish price action calls for caution, yet the absence of strong downside follow-through suggests that dip-buying remains the dominant theme. The key question now is whether prices will pull back further in the short term due to overbought conditions or attempt to reach the $3000 mark first.
Was Friday a Key Reversal Day for Gold or Just a Temporary Dip?
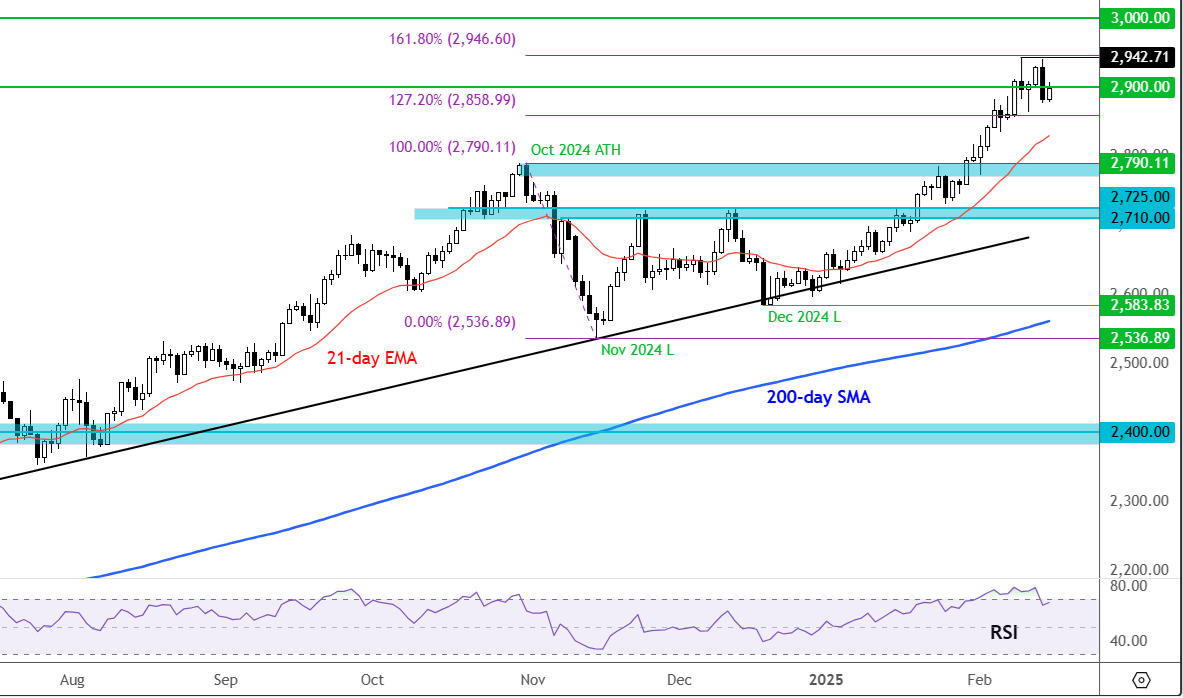
On Friday, gold experienced a sharp decline after failing to surpass the record high of $2942 set earlier in the week. It reached an intraday high of $2940 before plunging $63 to a session low of $2877. In the process, it broke through a key short-term support zone around $2900 to $2905. This level is now being tested from below, potentially turning into resistance. As long as gold does not close back above this area, bears may feel they have gained some control over short-term price action, especially given Friday’s bearish engulfing candle on the daily chart.
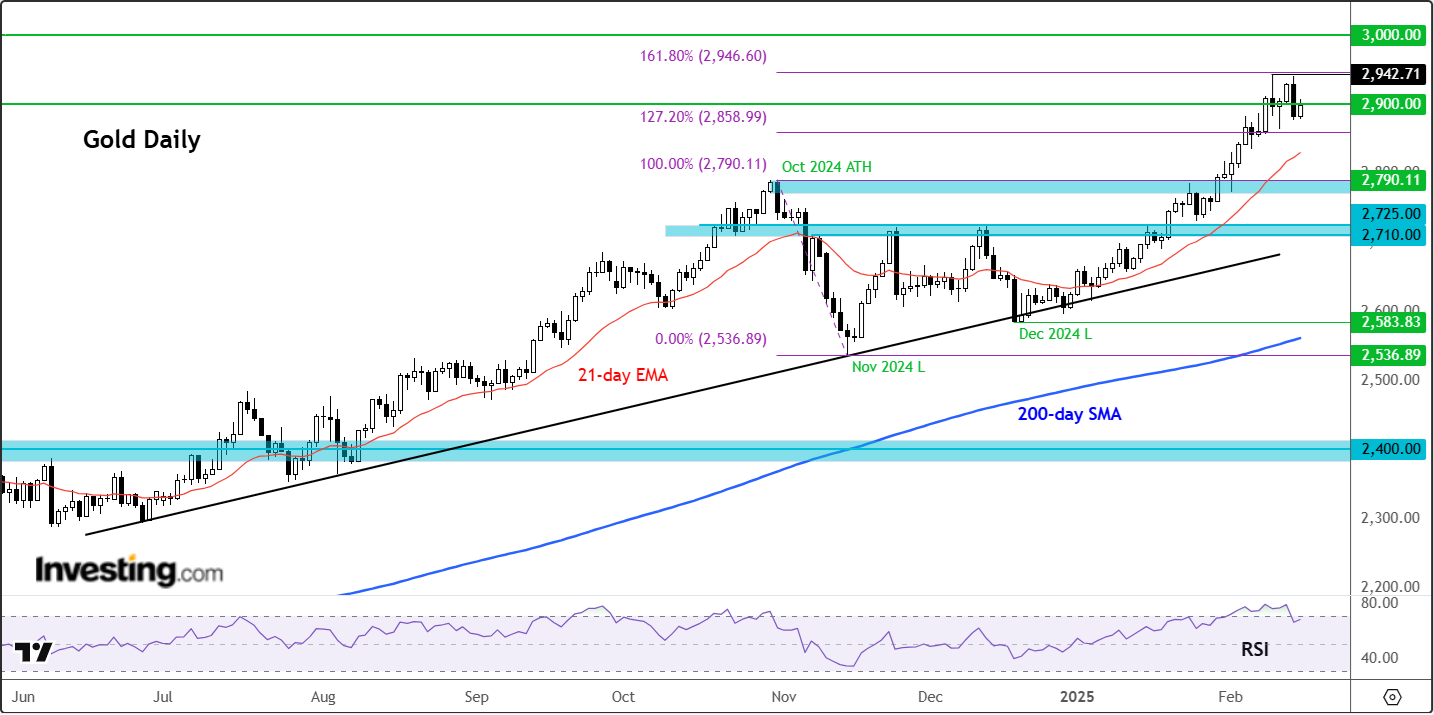
Gold-Daily Chart
Despite Friday’s reversal, gold remains in a strong uptrend, consistently setting new highs. However, signs of exhaustion are emerging. It remains to be seen how much selling pressure bears can exert, if any.
Gold had reached extreme levels according to the Relative Strength Index (RSI), which signaled overbought conditions across multiple timeframes. The daily RSI stood near 78 before Friday’s drop, which brought it down to just below 70.
To make matters worse, the weekly RSI remains around 75, showing a negative divergence with gold’s price—indicating a lower high in RSI despite a higher high in price. This divergence can be a warning sign of weakening momentum.
Meanwhile, the monthly RSI sits around 80.
These RSI levels suggest that a pullback or consolidation could be on the horizon, possibly already underway following Friday’s bearish reversal. However, the lack of sustained selling pressure has kept many bears on the sidelines—at least for now.
That said, the overbought RSI conditions and Friday’s price action serve as a cautionary signal for bulls, reminding traders not to take anything for granted.
What’s Driving Gold’s Volatility?
The U.S. dollar appears to be at the center of the recent volatility. Despite hotter-than-expected inflation data last week, the greenback softened following Trump’s more measured stance on tariffs, while EUR/USD found support as he expressed willingness to end the Ukraine conflict.
Previously, gold had been rallying despite the dollar’s strength, breaking the usual inverse relationship between the two. This decoupling from historical trends may have contributed to Friday’s sharp decline.
All of this raises the question: Is this the beginning of a long-overdue correction?
A correction in gold may be necessary to cool off speculative excess, particularly as Trump’s statement about resolving conflicts in Gaza and Ukraine could reduce safe-haven demand if he succeeds. At the same time, his protectionist policies and expansionary spending plans could keep U.S. inflation elevated, delaying rate cut expectations and supporting bond yields.
Disclaimer: This article is for informational purposes only and does not constitute financial advice, investment recommendations, or a solicitation to buy or sell assets. Any investment decision and the associated risks remain solely with the investor.
Leave A Comment